
In the Pre-Game Show post, Justin mentioned memory issues in our current game server, which required frequent restarts during the recording of the video because the server became unresponsive. Even though this is just a prototype, we decided to look into these problems — otherwise, we would just make the same mistakes again later.
To reproduce the situation without needing a bunch of real people to log on to a server and do stuff, we have a fairly simple script that simulates that: A set number of fake players that log in one by one (in the same location), and immediately start moving around without pause. The continuous movement causes a non-stop flow of messages from the clients to the server, which makes problems bubble up more quickly than in real-world use.
Monitoring the game server process memory usage while running that script resulted in this diagram:
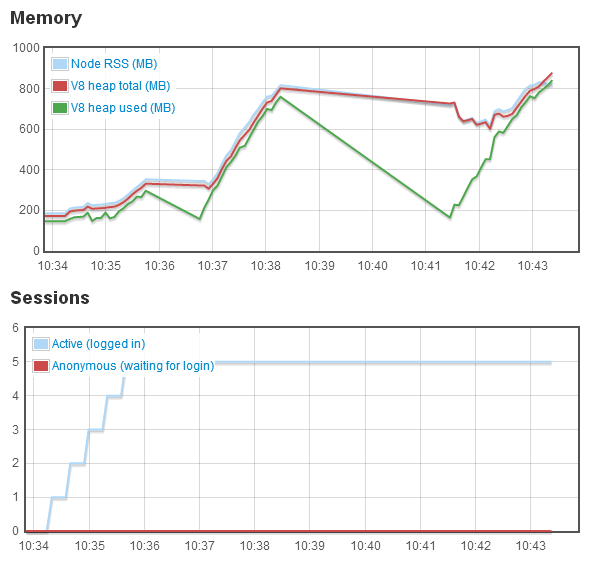
During the login phase, things still look more or less normal, and memory usage ramps up from below 200mb to ~350mb. After the fifth login though, something bad happens: The garbage collector starts a big cleanup cycle, and manages to free up over 100mb of memory — but it takes more than a minute to do that, making the server completely unresponsive during that time.
Following that, the players can continue running around (but memory is being consumed at an alarming rate), until it all comes to a grinding halt again, this time for over three minutes. Finally, it all goes pear-shaped and the server process just crashes (that’s where the graphs abruptly end towards the right).
In order to find out what is consuming memory so quickly, we first tried an analytic approach: Taking snapshots of the server process memory before and after certain operations (e.g. a player moving once), and comparing these snapshots. Unfortunately, this did not lead to any useful results, as there are a lot of unrelated things “going on” within the process even during short time intervals, making it very difficult to spot the changes relevant to our problem.
Instead, we had to switch to a somewhat more painful empiric approach: Removing “suspicious” parts of the code, bit by bit, and repeatedly running the aforementioned script, while closely watching for significant changes in the memory usage patterns. As you can imagine, this gets quite tedious after a while. While googling for less frustrating ways to solve such problems, I came across this half-joking remark by Ben Noordhuis (a long-time core node.js contributor), which I wholeheartedly agree with:
Tracking down memory leaks in garbage-collected environments is one of the great unsolved problems of our generation.
Eventually, we did find the culprit. A slightly simplified explanation: All of the game objects (players, items, locations etc.) are wrapped in a “persistence proxy” when they are loaded, which tells the persistence layer to save the object whenever it changes. When a nested property of an object is accessed (e.g. player.metabolics.energy or player.stats.xp), such a proxy has to be created for the subordinate layers (metabolics or stats in this example). Our mistake was creating these proxies on every access, instead of just once and keeping them around. Really obvious once you know it (as is often the case with bugs)!
After a pretty simple fix, the script produced much more pleasant results:
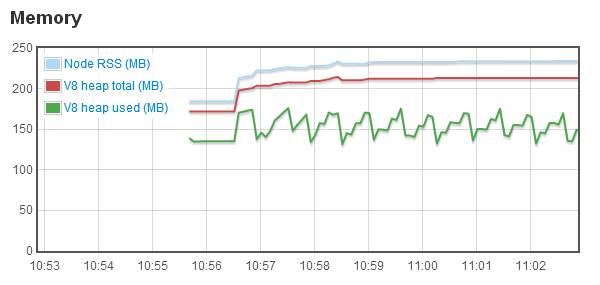
Looking good! Now, off to make this work for more than five players…